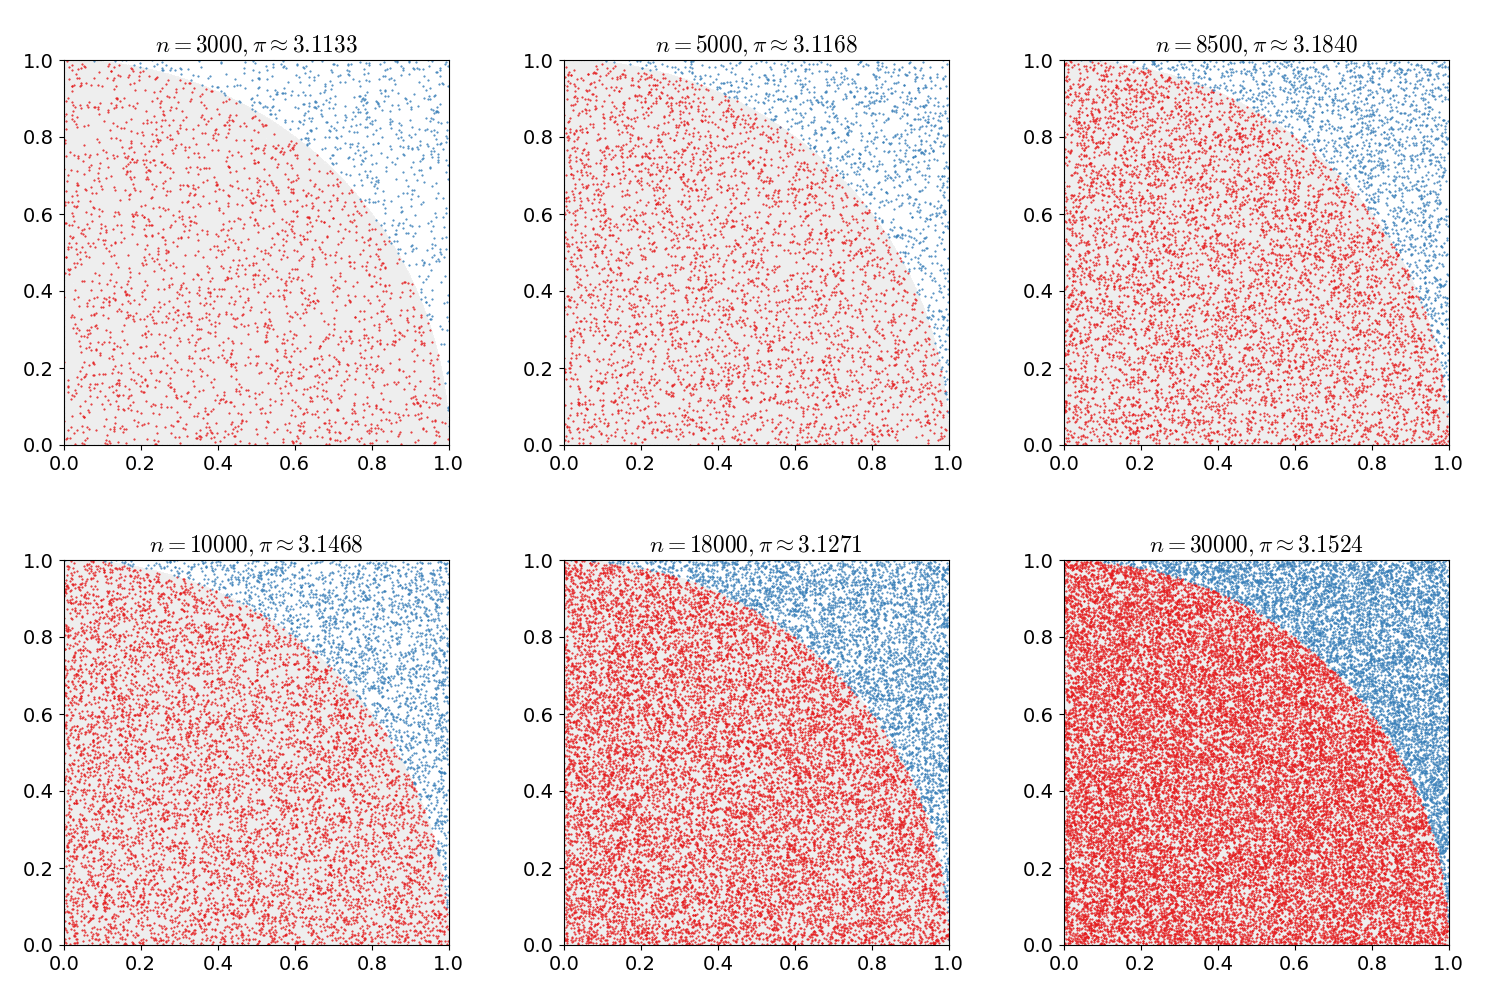
File:Pi 30K.gif
Pi_30K.gif (500 × 500 像素,檔案大小:476 KB,MIME 類型:image/gif、循環、10 畫格、2.0秒)
檔案歷史
點選日期/時間以檢視該時間的檔案版本。
| 日期/時間 | 縮圖 | 尺寸 | 用戶 | 備註 | |
|---|---|---|---|---|---|
| 目前 | 2017年2月16日 (四) 16:00 |  | 500 × 500(476 KB) | Nicoguaro | Make the plot square and increase gif delay. |
| 2017年2月16日 (四) 15:38 |  | 640 × 480(476 KB) | Nicoguaro | Bigger text in the axes, and colors from ColorBrewer. Code in Python. | |
| 2011年11月7日 (一) 18:29 |  | 500 × 500(373 KB) | Rayhem | Slowed animation to avoid looking like a blinky page element, improved resolution, added counter for number of points, shaded points inside/outside the circle. ==Mathematica 7.0 Source== <pre> tinyColor[color_, point_] := {PointSize[Small], color, Point[ | |
| 2011年3月14日 (一) 23:12 |  | 360 × 369(363 KB) | CaitlinJo | {{Information |Description ={{en|1=As points are randomly scattered inside the unit square, some fall within the unit circle. The fraction of points inside the circle over all points approaches pi as the number of points goes toward infinity. This ani |
檔案用途
全域檔案使用狀況
以下其他 wiki 使用了這個檔案:
- ar.wikipedia.org 的使用狀況
- be.wikipedia.org 的使用狀況
- bg.wikipedia.org 的使用狀況
- ca.wikipedia.org 的使用狀況
- da.wikipedia.org 的使用狀況
- el.wikipedia.org 的使用狀況
- en.wikipedia.org 的使用狀況
- en.wikibooks.org 的使用狀況
- eo.wikipedia.org 的使用狀況
- eu.wikipedia.org 的使用狀況
- fa.wikipedia.org 的使用狀況
- fr.wikipedia.org 的使用狀況
- he.wikipedia.org 的使用狀況
- hi.wikipedia.org 的使用狀況
- id.wikipedia.org 的使用狀況
- it.wikipedia.org 的使用狀況
- ja.wikipedia.org 的使用狀況
- ko.wikipedia.org 的使用狀況
- pt.wikipedia.org 的使用狀況
- sh.wikipedia.org 的使用狀況
- simple.wikipedia.org 的使用狀況
- sl.wikipedia.org 的使用狀況
- sr.wikipedia.org 的使用狀況
- sv.wikipedia.org 的使用狀況
- ta.wikipedia.org 的使用狀況
- test.wikipedia.org 的使用狀況
- tr.wikipedia.org 的使用狀況
- uk.wikipedia.org 的使用狀況
- vi.wikipedia.org 的使用狀況
- www.wikidata.org 的使用狀況
- zh-yue.wikipedia.org 的使用狀況


