
File:Bow echo diagram.svg

此 SVG 檔案的 PNG 預覽的大小:542 × 294 像素。 其他解析度:320 × 174 像素 | 640 × 347 像素 | 1,024 × 555 像素 | 1,280 × 694 像素 | 2,560 × 1,389 像素。
原始檔案 (SVG 檔案,表面大小:542 × 294 像素,檔案大小:204 KB)
摘要
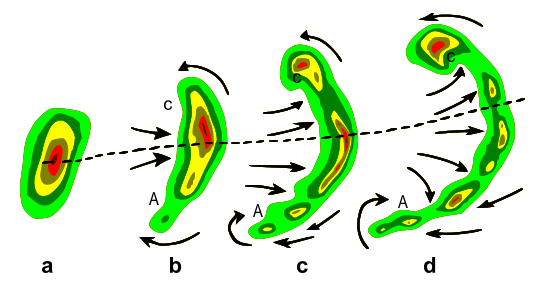
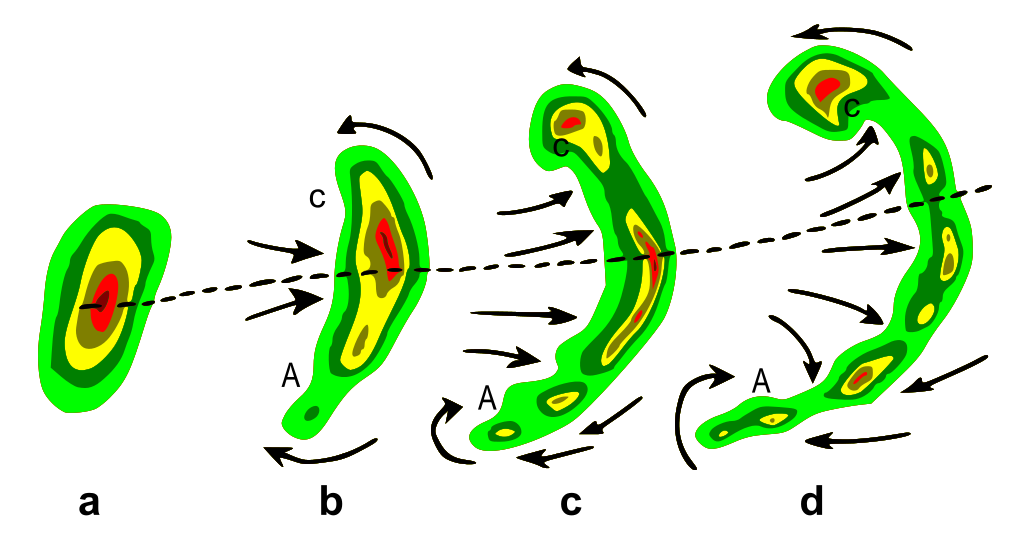
| 描述 | Typical evolution of a thunderstorm radar echo (a) into a bow echo (b, c) and into a comma echo (d). Dashed line indicates axis of greatest potential for downbursts. Arrows indicate wind flow relative to the storm. Note regions of cyclonic rotation (C) and anticyclonic rotation (A); both regions, especially C, are capable of supporting tornado development in some cases. |
| 日期 | Plain GIF version was uploaded to English Wikipedia as Bowecho1.gif on 9 Apr 2007 (UTC) by Utahweather. |
| 來源 | Vectorization of http://www.srh.noaa.gov/oun/severewx/figure1.php |
| 作者 | National Weather Service |
| 授權許可 (重用此檔案) |
Public domain |
授權條款
本圖像屬於公有領域,因該作品最初來自於美國國家海洋和大氣管理局職員的職務作品。
|
此作品基於公有領域中的作品。它已經過數字增強和/或修改。該衍生作品已(或特此)由其作者Remember the dot發布到公有領域。此授權條款在全世界均適用。
這可能在某些國家不合法,如果是的話: |
檔案歷史
點選日期/時間以檢視該時間的檔案版本。
| 日期/時間 | 縮圖 | 尺寸 | 使用者 | 備註 | |
|---|---|---|---|---|---|
| 目前 | 2007年4月11日 (三) 06:03 | | 542 × 294(204 KB) | Remember the dot | {{Information |Description=Typical evolution of a thunderstorm radar echo (a) into a bow echo (b, c) and into a comma echo (d). Dashed line indicates axis of greatest potential for downbursts. Arrows indicate wind flow relative to the storm. Note regions |
檔案用途
全域檔案使用狀況
以下其他 wiki 使用了這個檔案:
- af.wikipedia.org 的使用狀況
- ca.wikipedia.org 的使用狀況
- en.wikipedia.org 的使用狀況
- en.wikibooks.org 的使用狀況
- es.wikipedia.org 的使用狀況
- fi.wikipedia.org 的使用狀況
- fr.wikipedia.org 的使用狀況
- it.wikipedia.org 的使用狀況
- ja.wikipedia.org 的使用狀況
- lmo.wikipedia.org 的使用狀況
- mk.wikipedia.org 的使用狀況
- nl.wikipedia.org 的使用狀況
- pl.wikipedia.org 的使用狀況
- pt.wikipedia.org 的使用狀況
- sk.wikipedia.org 的使用狀況
- sv.wikipedia.org 的使用狀況
- sw.wiktionary.org 的使用狀況