
File:Oil price 1900 int.png
本预览的尺寸:800 × 302像素。 其他分辨率:320 × 121像素 | 640 × 241像素 | 1,740 × 656像素。
原始文件 (1,740 × 656像素,文件大小:33 KB,MIME类型:image/png)
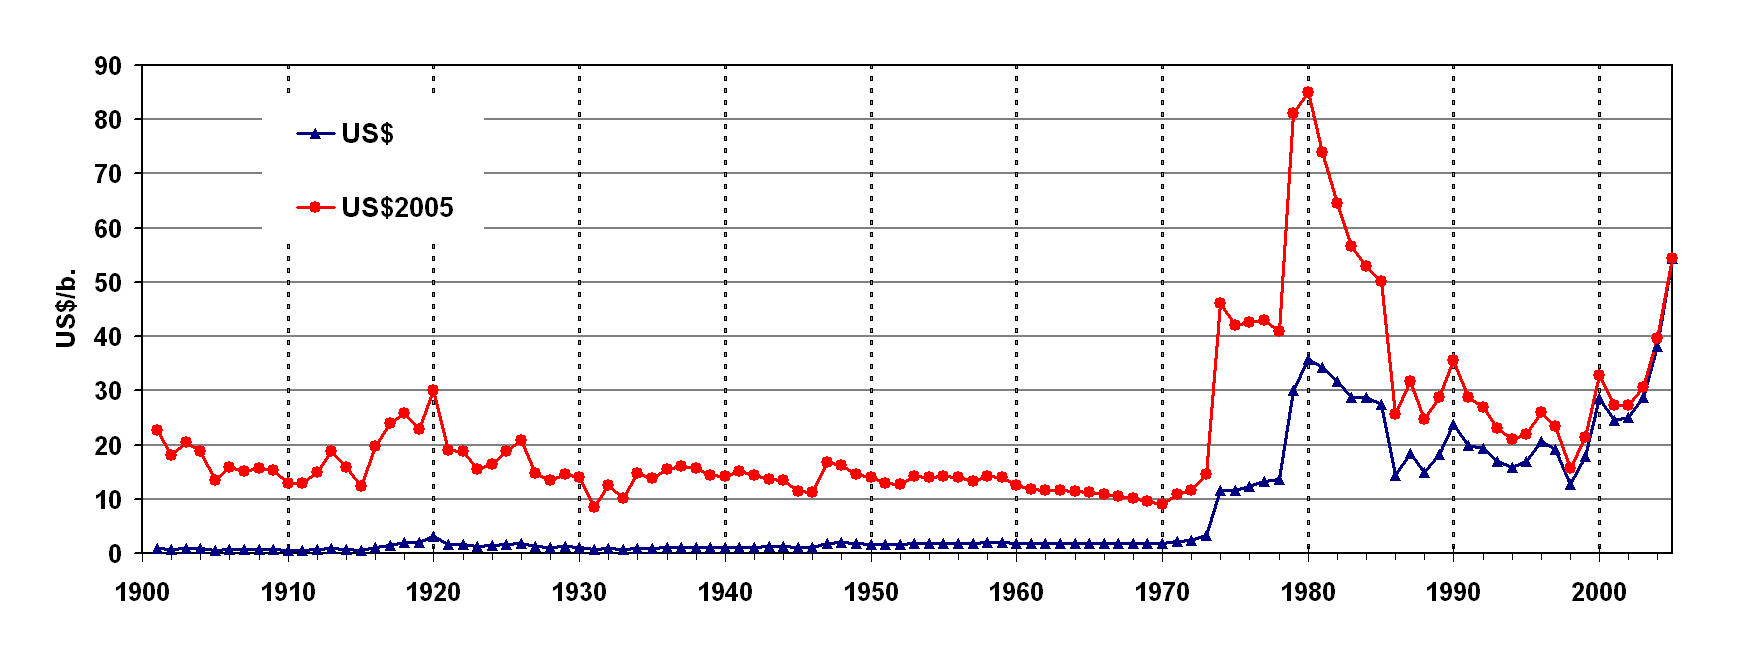
| 描述 | Evolution of the crude oil price (data by BP, see raw data at the bottom): nominal prices (2005=100%) and real prices in US dollar; not language specific (int). |
| 日期 | |
| 来源 | author, using data: see below |
| 作者 | user:MGTom |
| 授权 (二次使用本文件) |
GFDL |
| 其他版本 | Image:Oilprice 1900.png by Thomas Steiner |
我,本作品著作权人,特此采用以下许可协议发表本作品:

|
已授权您依据自由软件基金会发行的无固定段落及封面封底文字(Invariant Sections, Front-Cover Texts, and Back-Cover Texts)的GNU自由文件许可协议1.2版或任意后续版本的条款,复制、传播和/或修改本文件。该协议的副本请见“GNU Free Documentation License”。 |
| 本文件采用知识共享署名-相同方式共享 3.0 未本地化版本许可协议授权。 | ||
| ||
| 本许可协议标签作为GFDL许可协议更新的组成部分被添加至本文件。 |
您可以选择您需要的许可协议。
Data from BP Workbook:
- -1945 US average price
- 1946-1985 Arabian Light posted at Ras Tanura
- 1986- Brent Spot
 ;US$;US$2005
1901;0,96;22,60
1902;0,8;18,11
1903;0,94;20,50
1904;0,86;18,76
1905;0,62;13,52
1906;0,73;15,92
1907;0,72;15,14
1908;0,72;15,70
1909;0,7;15,27
1910;0,61;12,83
1911;0,61;12,83
1912;0,74;15,02
1913;0,95;18,83
1914;0,81;15,85
1915;0,64;12,40
1916;1,1;19,81
1917;1,56;23,93
1918;1,98;25,87
1919;2,01;22,86
1920;3,07;30,15
1921;1,73;19,03
1922;1,61;18,90
1923;1,34;15,45
1924;1,43;16,45
1925;1,68;18,86
1926;1,88;20,90
1927;1,3;14,73
1928;1,17;13,43
1929;1,27;14,58
1930;1,19;14,01
1931;0,65;8,40
1932;0,87;12,53
1933;0,67;10,17
1934;1;14,67
1935;0,97;13,89
1936;1,09;15,44
1937;1,18;16,13
1938;1,13;15,76
1939;1,02;14,42
1940;1,02;14,28
1941;1,14;15,20
1942;1,19;14,33
1943;1,2;13,63
1944;1,21;13,51
1945;1,05;11,46
1946;1,12;11,27
1947;1,9;16,70
1948;1,99;16,23
1949;1,78;14,66
1950;1,71;13,94
1951;1,71;12,92
1952;1,71;12,64
1953;1,93;14,16
1954;1,93;14,09
1955;1,93;14,15
1956;1,93;13,93
1957;1,9;13,24
1958;2,08;14,13
1959;2,08;14,01
1960;1,9;12,59
1961;1,8;11,81
1962;1,8;11,68
1963;1,8;11,53
1964;1,8;11,38
1965;1,8;11,20
1966;1,8;10,86
1967;1,8;10,57
1968;1,8;10,15
1969;1,8;9,63
1970;1,8;9,09
1971;2,24;10,86
1972;2,48;11,64
1973;3,29;14,52
1974;11,58;46,07
1975;11,53;42,04
1976;12,38;42,66
1977;13,3;43,04
1978;13,6;40,89
1979;30,03;81,13
1980;35,69;84,94
1981;34,28;73,90
1982;31,76;64,48
1983;28,77;56,60
1984;28,78;52,86
1985;27,56;50,11
1986;14,43;25,63
1987;18,43503937;31,68
1988;14,9238417;24,71
1989;18,22611328;28,69
1990;23,72582031;35,62
1991;20,00338521;28,79
1992;19,32083658;26,98
1993;16,97163424;23,09
1994;15,81731518;21,07
1995;17,01667969;22,03
1996;20,66848837;25,94
1997;19,09258755;23,51
1998;12,71566148;15,71
1999;17,97007782;21,41
2000;28,49544922;32,88
2001;24,44389105;27,34
2002;25,02325581;27,36
2003;28,83;30,62
2004;38,265;39,57
2005;54,4;54,40
文件历史
点击某个日期/时间查看对应时刻的文件。
| 日期/时间 | 缩略图 | 大小 | 用户 | 备注 | |
|---|---|---|---|---|---|
| 当前 | 2006年8月6日 (日) 06:38 | 1,740 × 656(33 KB) | MGTom | {{Information evolution of the crude oil price (data by BP, see raw data at the bottom): nominal prices (2005=100%) and real prices in US dollar |Description= evolution of the crude oil price (data by BP, see raw data at the bottom): nominal prices (2005= |
文件用途
以下页面使用本文件:
全域文件用途
以下其他wiki使用此文件:
- en.wikipedia.org上的用途
- sl.wikipedia.org上的用途
- sr.wikipedia.org上的用途