
File:Halogenated gas concentrations 1978-present.png
本预览的尺寸:800 × 516像素。 其他分辨率:320 × 206像素 | 640 × 412像素 | 928 × 598像素。
原始文件 (928 × 598像素,文件大小:24 KB,MIME类型:image/png)
摘要

|
该文件可能会更新以反映新信息 如果您希望在不镜像新更新的情况下使用该文件的特定版本,请将所需版本作为单独的文件上传。 |
| 描述 |
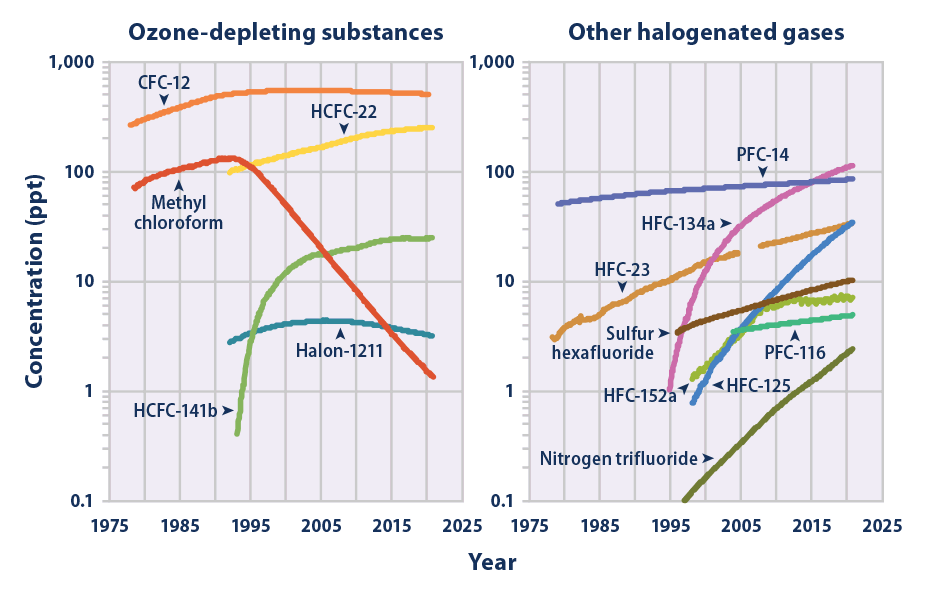
English: The two graphs show global changes in the concentration (measured in parts per trillion, or ppt) of several important halogenated gases in Earth's atmosphere. The data were collected from sites around the world between years 1978 and 2021. The left graph shows gases which cause substantial ozone depletion, as well as atmospheric heating. The right graph shows gases whose main impact is global warming.
All of the gases are human-made and manufactured in industrial amounts starting as early as the mid-twentieth century. Severe depletion of Earth's protective ozone layer inspired efforts to reduce the production of some gases starting the late 1980s. Overall, the manufacture of most other gases is still rapidly increasing, as indicated by the logarithmic scale used to graph the concentrations. Data Sources/References:
|
| 日期 | |
| 来源 | https://www.epa.gov/climate-indicators/climate-change-indicators-atmospheric-concentrations-greenhouse-gases |
| 作者 | United States Environmental Protection Agency - Unauthored |
许可协议
本图像属于公有领域,因该作品最初来自于美国国家海洋和大气管理局职员的职务作品。
|
文件历史
点击某个日期/时间查看对应时刻的文件。
| 日期/时间 | 缩略图 | 大小 | 用户 | 备注 | |
|---|---|---|---|---|---|
| 当前 | 2022年8月29日 (一) 06:37 | | 928 × 598(24 KB) | A876 | updated by author to cover 1978-2021. |
| 2022年4月15日 (五) 00:03 |  | 928 × 598(24 KB) | A876 | compacted. octree from RGB (3348 colors) (no noticeable change) to 256 colors. zopfli png compression (lossless). | |
| 2022年4月14日 (四) 23:49 |  | 928 × 598(74 KB) | A876 | updated by author to cover 1978-2018. (includes ALL of the previous version (1978-2015), so REPLACING it is no loss.) | |
| 2020年9月25日 (五) 17:05 |  | 928 × 598(77 KB) | Bikesrcool | Uploaded a work by United States Environmental Protection Agency - Unauthored from https://www.epa.gov/climate-indicators/climate-change-indicators-atmospheric-concentrations-greenhouse-gases with UploadWizard |
文件用途
以下页面使用本文件:
全域文件用途
以下其他wiki使用此文件:
- bn.wikipedia.org上的用途
- en.wikipedia.org上的用途
- es.wikipedia.org上的用途
- fr.wikipedia.org上的用途
- it.wikipedia.org上的用途